
S-100 data can generate significant value not only for navigation but for the maritime industry as a whole. This article tells you how.
As e-navigation becomes more widespread, the amount of maritime data that allow mariners to navigate safer and more efficiently increases rapidly. To help mariners integrate and visualize these datasets easily in their navigation systems, the International Hydrographic Organization (IHO) has developed the S-100 framework.
Underpinning e-navigation, S-100 standardizes maritime data and supports the development of hydrographic-related digital sources and products, such as high-resolution bathymetric data, surface current data and a new standard for Electronic Navigational Charts (ENCs).
Although the S-100 framework is recognized as the fundamental standard for a joint maritime data structure for e-navigation, S-100 is not limited to navigational purposes. The S-100 framework also consists of standards designed for different purposes, making the framework relevant for a wide variety of hydrographic, maritime and GIS communities.
In this article, we will challenge the preconception that S-100 data only can be used for navigational purposes and demonstrate how S-100 data also can generate significant value for the maritime industry as a whole.
Read also: The Ultimate Guide to S-100 Data and Products
How S-100 Data Can Improve Port Operations
Detailed hydrographic data may become particularly relevant for shipping, port and docking offices, helping to accommodate efficient, safe and flexible shipping traffic in and out of ports and harbours.
Today, ports and harbours typically struggle with lack of high-resolution bathymetric data, making it difficult to properly plan and calculate whether it is safe for certain vessels and ships to dock. For example, docking offices may want to figure out whether a wide fender between the quay and the dock will make it possible for a cruise ship to safely approach the port. However, without high-resolution data, this operation becomes difficult, if not impossible. The result is that the available navigational space cannot be fully exploited, as safety margins due to lack of precise information tend to be increasingly large.
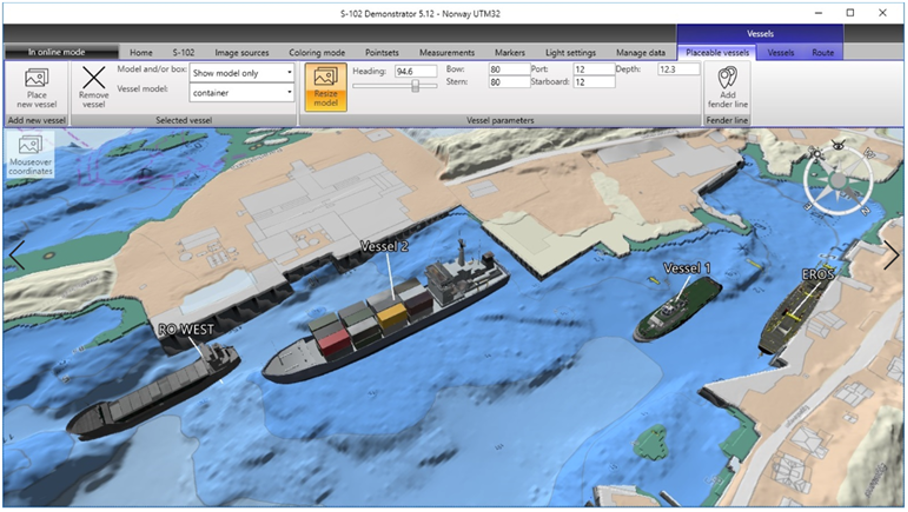
This is where S-100 data comes in, particularly S-102 bathymetric data. Originally intended to enable safe and precise navigation at sea, S-102 enables end-users to generate 3D visualizations of underwater ocean floors – information that can be leveraged to improve the safety of operations in ports and harbours.
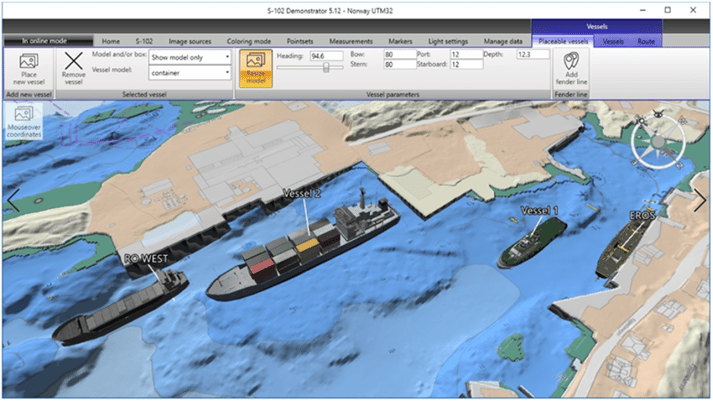
Figure 1: High resolution bathymetry utilized to visualize the harbour basin in a 3D view.
The following scenarios and use cases may prove to become some of the most promising opportunities for S-102 usage in port operations:
- Increased safety of anchoring operations: S-102 data may increase anchoring operations’ safety in situations where ships are required to anchor while waiting to dock. Detailed bathymetric data can be used to visualize the subsurface so that it is possible to place anchors in preferred positions to minimize dredging risks and generally increase the safety of anchoring operations.
- Docking and fender usage: When docking in too shallow harbours, fenders or other floating objects are typically used to expand the quay wall to an area considered deep enough. Detailed bathymetric data, combined with vessel specific hull shape information, may be used to calculate and visualize how much the quay needs to be expanded to ensure sufficient under-keel safety margins.
- Improved calculations of borrow pits: S-102 data may also help plan to expand existing port areas to increase the dock basin’s depth. Detailed bathymetric data may be used to calculate the volume of masses that has to be removed. Combined with information on the subsurface environment (deposits or solid ground), S-102 data may help contractors plan potential expansion initiatives.
- Reduced traffic density: High traffic density regularly generates port congestions and limits vessel manoeuvring possibilities. S-102 data can generate real-time information and simulation opportunities for safe navigation and maneuvering outside port waterways.
How S-100 Data May Help Plan Development Projects in Coastal Municipalities
S-100 data may also generate considerable value for public administration. Easy access to S-100 data will help local and regional authorities plan various development projects in coastal areas.
When researching and preparing necessary grounds for decision making concerning coastal area development projects, municipalities typically consider a wide range of factors potentially influencing the project, such as biodiversity, business sector interests, building regulations, subsea infrastructure and body of water movements. Electronic chart data is an indispensable part of this process, helping local authorities correctly understand the area to be potentially developed.
However, local authorities typically struggle with limited access to relevant and detailed data that helps them properly understand the area that is to be developed. As a consequence, the grounds for decision-making may end up lacking critical information.
Local authorities in coastal areas may find that S-100 data and products can improve their decision-making processes and provide them with new information relevant to development projects. For example:
- S-101 data: Local authorities often lack detailed information on subsea infrastructure, which may or may not be relevant to a proposed development project. S-101 data may be used to gain relevant infrastructure overview of subsea cables and pipelines.
- S-102 data: High-resolution bathymetric data initially intended to be used for safe navigation, may be used to chart marine mineral resources and other subseafloor conditions.
- S-104/S-111 data: Historical data series for tidal water, tidal streams and surface currents may provide useful information necessary to understand the physical impact these factors may cause in a specific area of interest.
Read also: Helping the Canadian Hydrographic Service (CHS) Leverage S-100 Data

Optimal Placement of Fish Farms with S-100 Data in the Aquaculture Industry
High-resolution hydrographic data may also prove to become important for the aquaculture industry, promising to reduce financial losses, help identify optimal positioning of new fish farms and reduce application process lead times for new on-sea infrastructure.
Take the development and construction of new fish farms as an example. When planning new installations, aquaculture companies need to consider several factors that significantly influence living conditions for fish and overall fish farm performance, such as temperature, weather conditions, bathymetric data, neighbouring biotopes and surface currents.
Today, however, the aquaculture industry regularly struggles to get their hands on the necessary data and information to position the fish farms optimally. The lack of data often leads to suboptimal placements of new fish farms, significantly impacting the fishes’ growth conditions and consequently contributing to considerable monetary losses.
The new S-100 standard, particularly the S-102 and S-111 datasets, promises to significantly relieve the pains of fish farm placement for the aquaculture industry. Although the S-102 and S-111 products are initially developed for navigational purposes, they can be utilized as a data foundation to improve decision-making on fish farm locations. They visualize underwater ocean floors and surface currents, respectively, and may be used to calculate the optimal position of on-sea fish farms.
Calculations performed by Sopra Steria estimates the cost reduction opportunities of efficient utilization of S-100 data for the aquaculture industry to be in the magnitude of several hundreds of millions NOK.
Conclusion
Market players interested in the opportunities inherent in the new S-100 paradigm should be careful not to limit their conception to navigational use cases but also consider the many other possibilities S-100 creates for the maritime industry in general. As the above use cases exemplify, S-100 data may become viable for communities outside the scope of traditional navigation.
The use cases highlighted in this article are just some of many potential possibilities. As the S-100 standard continues to develop and new S-100 data and products increasingly become available, new use cases for other industries and markets may emerge. Distributors, value-added resellers and maritime software developers are only bound by the limits of their imagination.
Chart distributors, OEMs and end-users looking to leverage the opportunities of S-100 datasets and products need to look no further. The technology necessary to ensure efficient dissemination of S-100 data is already available and ready to be leveraged by anyone who recognises its value. If you are interested in investigating the opportunities of the brand-new S-100 service, get access to a 3 Month Free Trial by following the link below:

Feel free to reach out to us in ECC for more information on how you can begin your S-100 journey today. Also check out the Electronic Navigational Chart (ENC) service PRIMAR which offers the necessary infrastructure, tools and services to leverage the opportunities of S-100 products and datasets.