

The S-100 Demonstrator project proves in an operational test how new technology can be used in practice, and how implementation and use of S-129 in confined and challenging waters can create added value for the maritime industry.
In a first-time test, pilot Karl Helge Haagensen from The Norwegian Coastal Administration navigated a tanker through the narrow strait of Tjeldsundet, Norway, using the S-129 datasets and the S-100 demonstrator in December 2021.
An experienced mariner, Haagensen knew the strait to be challenging, with shallow waters and strong surface currents. Historically, in traditional navigation, detailed depth information between the depth contours in navigational charts has not been accessible. With the S-100 Demonstrator, all relevant information was presented to Haagensen on one single on-screen map. The S-129 information ensured comprehensive visual control of navigable and non-navigable areas.
The test demonstrated that in addition to safer sailing, the precise information presented to pilots and navigators offers both logistical and commercial advantages.
Haagensen summed up the advantages of S-129 thus:
- We can document safe sailing depths in advance. This means being able to sail as soon as the tide is high enough and saving time by not having to wait for high tide. Ships can be loaded heavier, which means fewer trips, or they can choose shorter new routes and save fuel.
The successful, first-ever test of S-129, also including other S-100 datasets in the Tjeldsundet test showed that the new data types provide safer sailing conditions, especially by the use of S-129 - the new under keel clearance product built on the S-100 Hydrographic Datamodel. The promising outcome demonstrates more efficient sailing routes in terms of economy, safety, and environmental concerns.
The Tjeldsund operational test was hugely important to the S-100 Demonstrator project. The test took place aboard the Tern Ocean vessel, owned and operated by Terntank, which proved to be an ideal vessel for such an endeavor.
The initial goal for the project was to test datasets based on the new standards; S-101, S-102, S-111, and S-129, with a particular focus on the latter. By combining the datasets, we could test and visualize the four S-100 data types simultaneously in one view.
- See video: Voyage through Tjeldsundet
Through the project collaboration with OMC International, we managed to use some of the different S-100 datatypes as input to the S-129 Under Keel Clearance modeling. This is the first time this has ever been done and carried out commercially.
Tjeldsundet was chosen for the test for a number of reasons:
We wanted challenging sailing conditions in confined shallow waters with strong surface currents, where the different S-100 products could be used together in an end-user system to facilitate enhanced voyage planning and voyage execution processes.
It was important that the vessel size and passage through the test area would require pilot assistance, and that experienced mariners such as the pilots were able to provide feedback on the usability of the different S-100 data types.
S-129 Offers Shorter and Safer sailing
We wanted to highlight in this test how the new data types, based on these new standards, can expand the navigable maneuver room. This, in turn, could provide both economic, environmental and safety benefits, as it would allow for shorter but still safe sailing routes.
Tjeldsundet is close to the city of Harstad and above the arctic circle. The currents here are strong. The strait is shallow, with the shoalest depths between nine and ten meters in the sailing corridor. This increases the hydrodynamic effect which makes the ship sit lower in the water.
Sailing through Tjeldsundet instead of outside the Lofoten/Vesterålen archipelago gives a reduced sailing distance of 65 nautical miles. Assuming a frequency of five voyages per month, this adds up to almost 4.000 nautical miles saved per year, with the subsequent lowering of fuel costs, emissions, and person-hours.
In addition to this, the extra information served up by the data sets could contribute to a lower number of incidents. Also, a raised awareness of identified challenges will, assumedly, lead to more accurate identification of no-go areas.
- Further reading: Excerpt of the full test report
- Further reading: Pilot tests new digital tools
The outcome of the test was successful. The S-129 and the other S-100 products visualized in the end-user application S-100 Demonstrator provided valuable information for the end-user, especially for planning purposes. The image below demonstrates the non-navigable (red) and almost non-navigable (yellow) areas provided by the S-129 data.
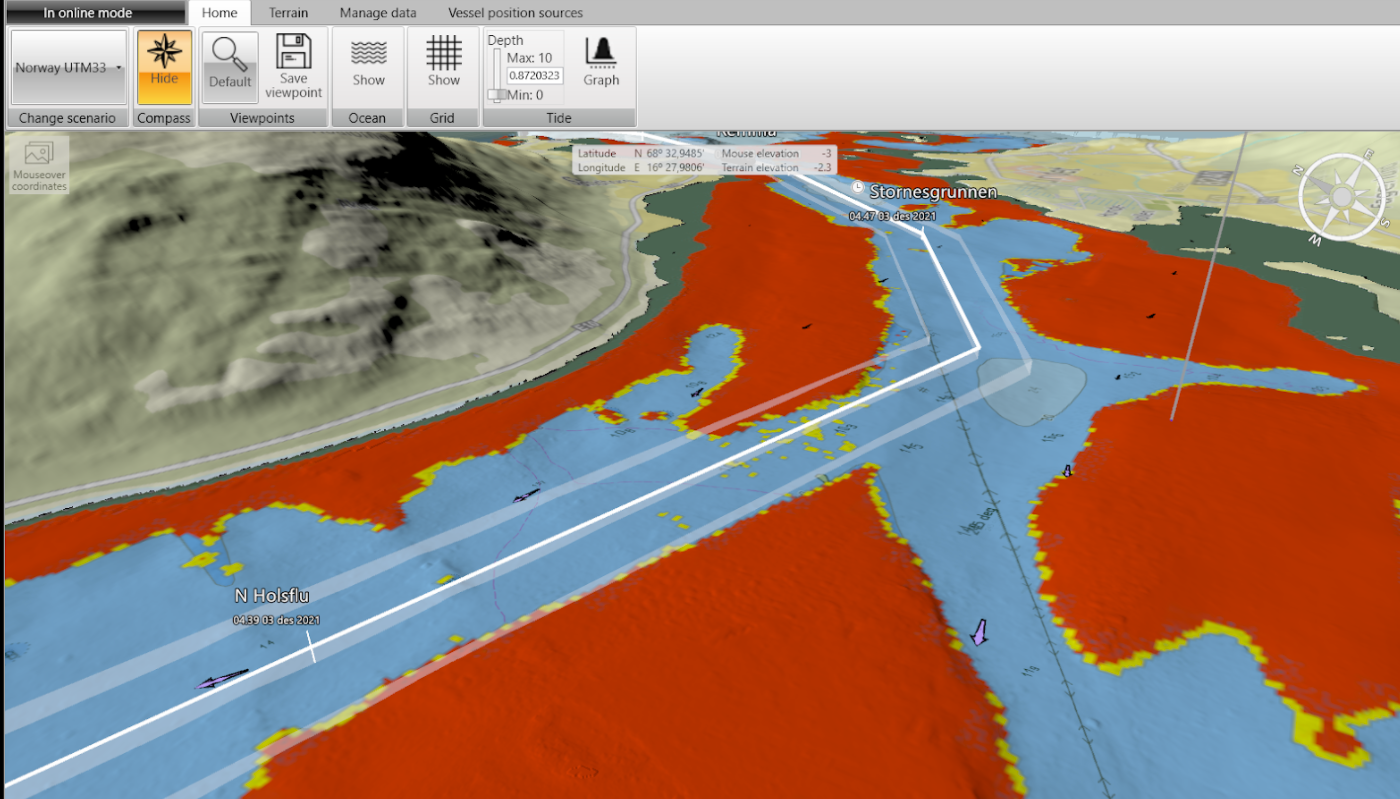
During the live test, the S-129 data was updated with one-minute intervals using 4G connectivity, continuously ensuring precise and updated information in the end-user system onboard.

Advantages Demonstrated by the S-129 Test
The test voyage demonstrated that the S-129 data set has substantial advantages:
- Freight vessels can carry more load, increasing the commercial value of the individual trip
- Time spent waiting for high tide can be reduced
- New routes can be picked out for sailing, potentially reducing the distance of sailing
- Added value to the voyage planning process ensures safer voyage execution
The Tjeldsundet test was very successful. Not only were we able to test the data sets properly, but the data sets also turned out to perform well in challenging conditions and return the desired results.
Facts – The S-100 Demonstration Project |
|
The chart display tool S-100 Demonstrator was used both in planning and during the pilotage itself through the Tjeldsundet. The tool has previously been used in particularly advanced pilotage assignments, such as piloting the world’s largest semi-submersible crane vessel “Sleipnir” to Haugesund in April 2020. The operational test of S-129 in Tjeldsundet was part of the S-100 Demonstrator research and development project, an extension of the S-102 Demonstrator Project in which the chart display tool that shows depth data in 3D has been developed. Both projects are financed with funding from the Research Council of Norway and the MAROFF2 program. In this project, the Norwegian Coastal Administration is working closely with the Norwegian Mapping Authority, the Norwegian Armed Forces, PRIMAR and Kongsberg Digital, as well as the ports of Stavanger and Kristiansand, to research and develop new digital display tools and the use of international standards for better safety at sea. The project is being led by the Electronic Chart Centre (ECC). The aim of the research and development project is to develop a tool that collects useful and quality-assured geographical information in one place, to ensure that navigators and others who need this data can access it from one source. Other examples, besides electronic chart and depth data, are information about currents, weather and the state of the tide, which are important details for navigators and others who are planning voyages. |